The product
You see which station is charging and which one is idle.
The overview shows every charge point with its state, its power and its last sign of life.
Every siteEvery makeAlarm after two hoursThe overview answers four questions
- How many charge points are charging right now.
- Which charge point has been idle since this morning.
- How much power is being drawn at this moment.
- Which station reported in most recently.
This is what the overview looks like
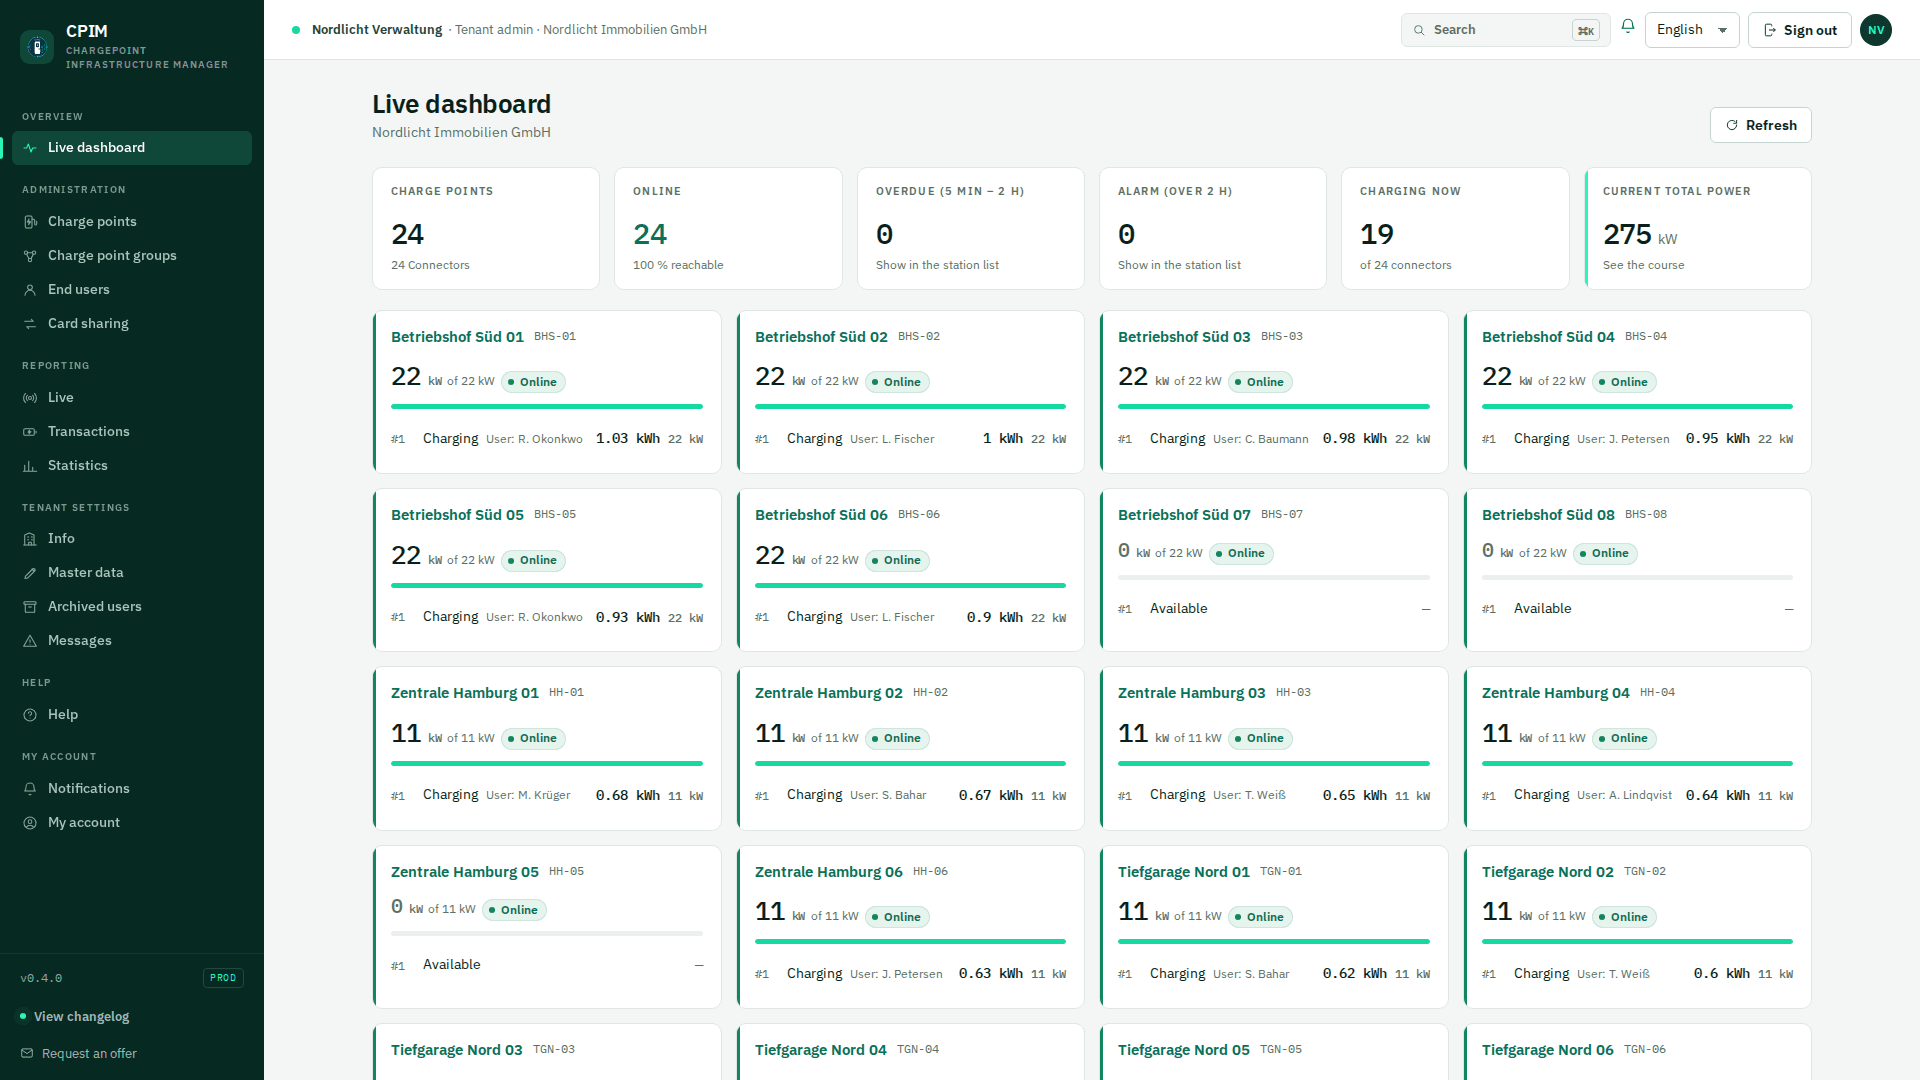
The state sits on every tile
Available, charging, faulted. The state appears as a colour and additionally as a word.
The power follows the session
Power and meter reading come from the station and follow the running charging session.
An alarm reports the silent station
Every station sends a regular sign of life. Two hours of silence raise an alarm.
Who is charging right now, on one page
Power, meter reading and person, while the session runs.
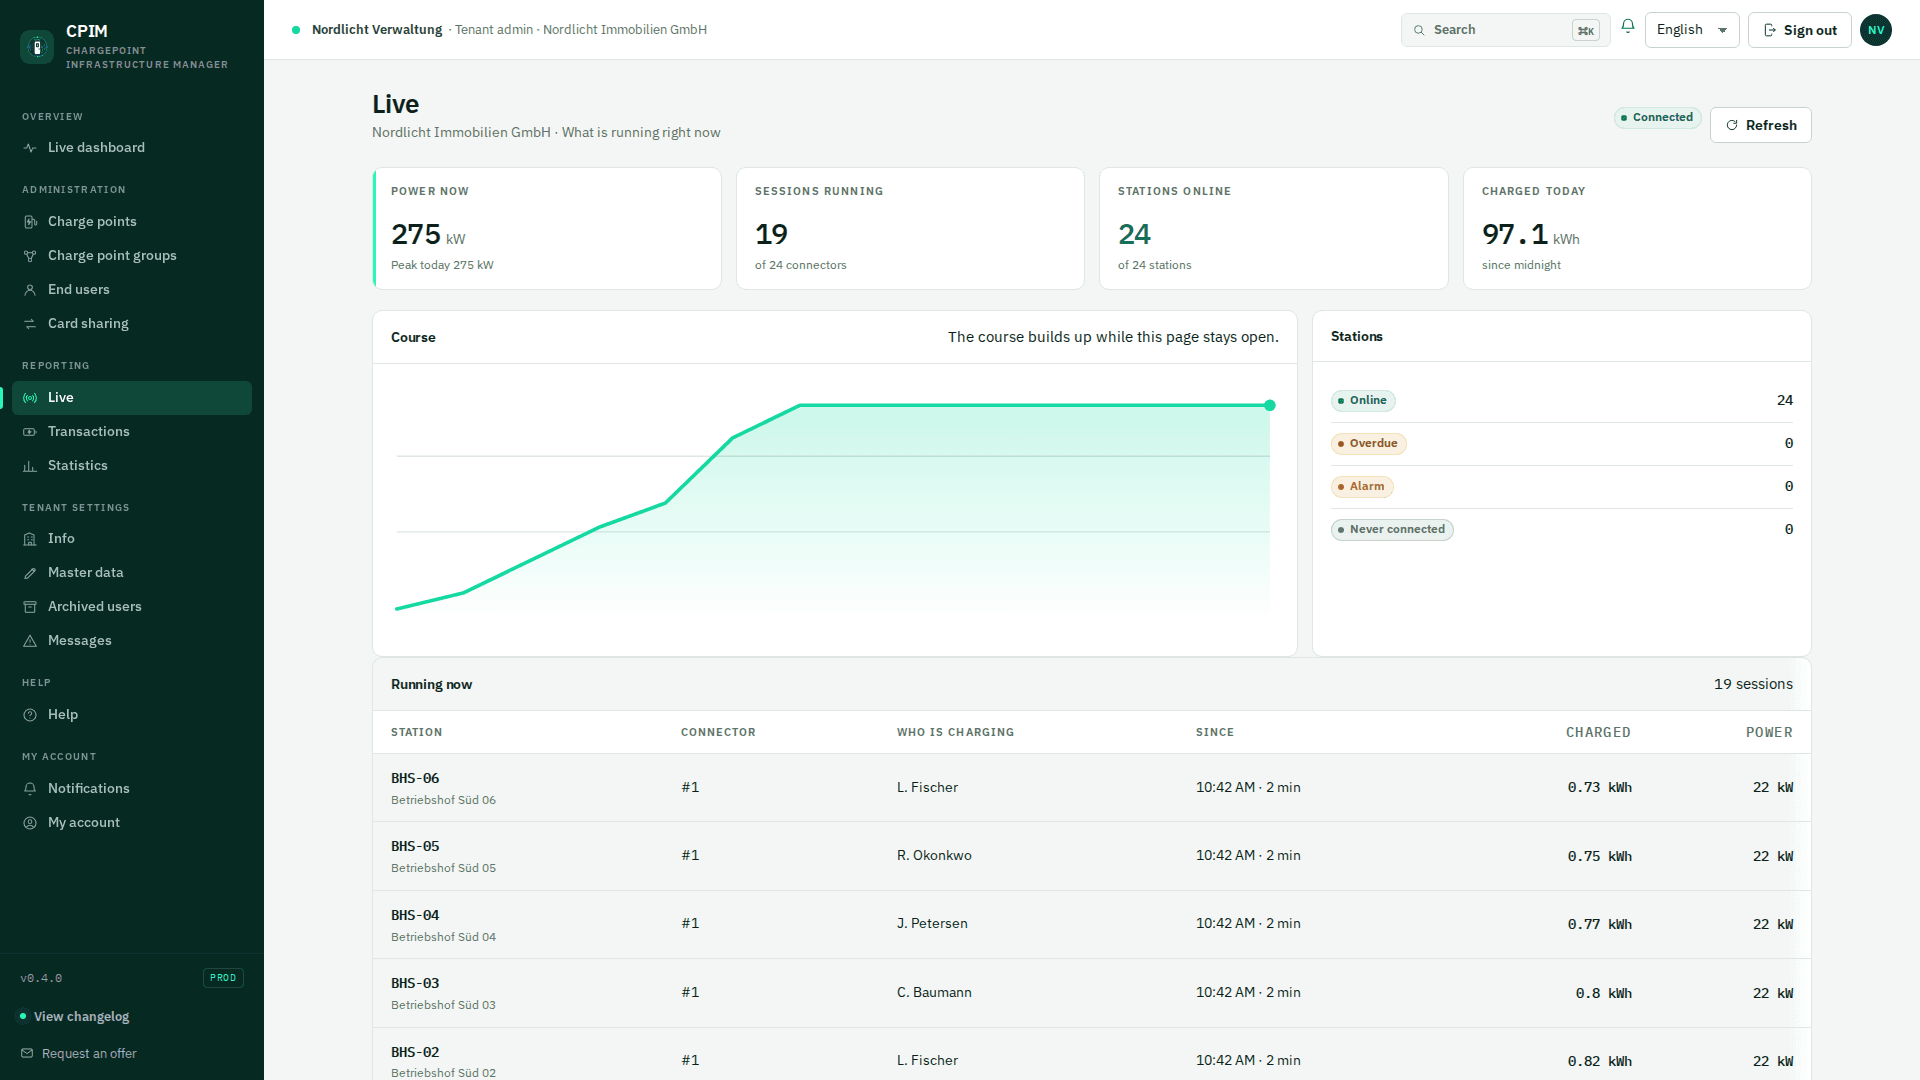
One click leads from the overview into the detail
Every charge point on its own
One click opens the station with its charging group, its state and its utilisation.
Read more →A session from start to finish
Start, card, meter values and end are held together as one session.
Read more →Faults stand out
The message appears inside the application, for the operator and for the organisation affected.
Read more →
Take a proper look at the overview.
A short enquiry is enough, and a person answers it.
Prefer e-mail? info@dstech-it.de